Input on recent market volatility
As you likely know, this recent sell-off has caused most indexes to draw near or enter “Correction” levels. I’ve touched on this somewhat arbitrary term before. It is loosely defined as a decline of -20%. Over the past decade or so there have been several drawdowns that reached this level and many more that were just a few percentage points short of hitting the magic number. Adding to the confusion is defining which stock index to follow, with the major ones differing significantly during some periods.
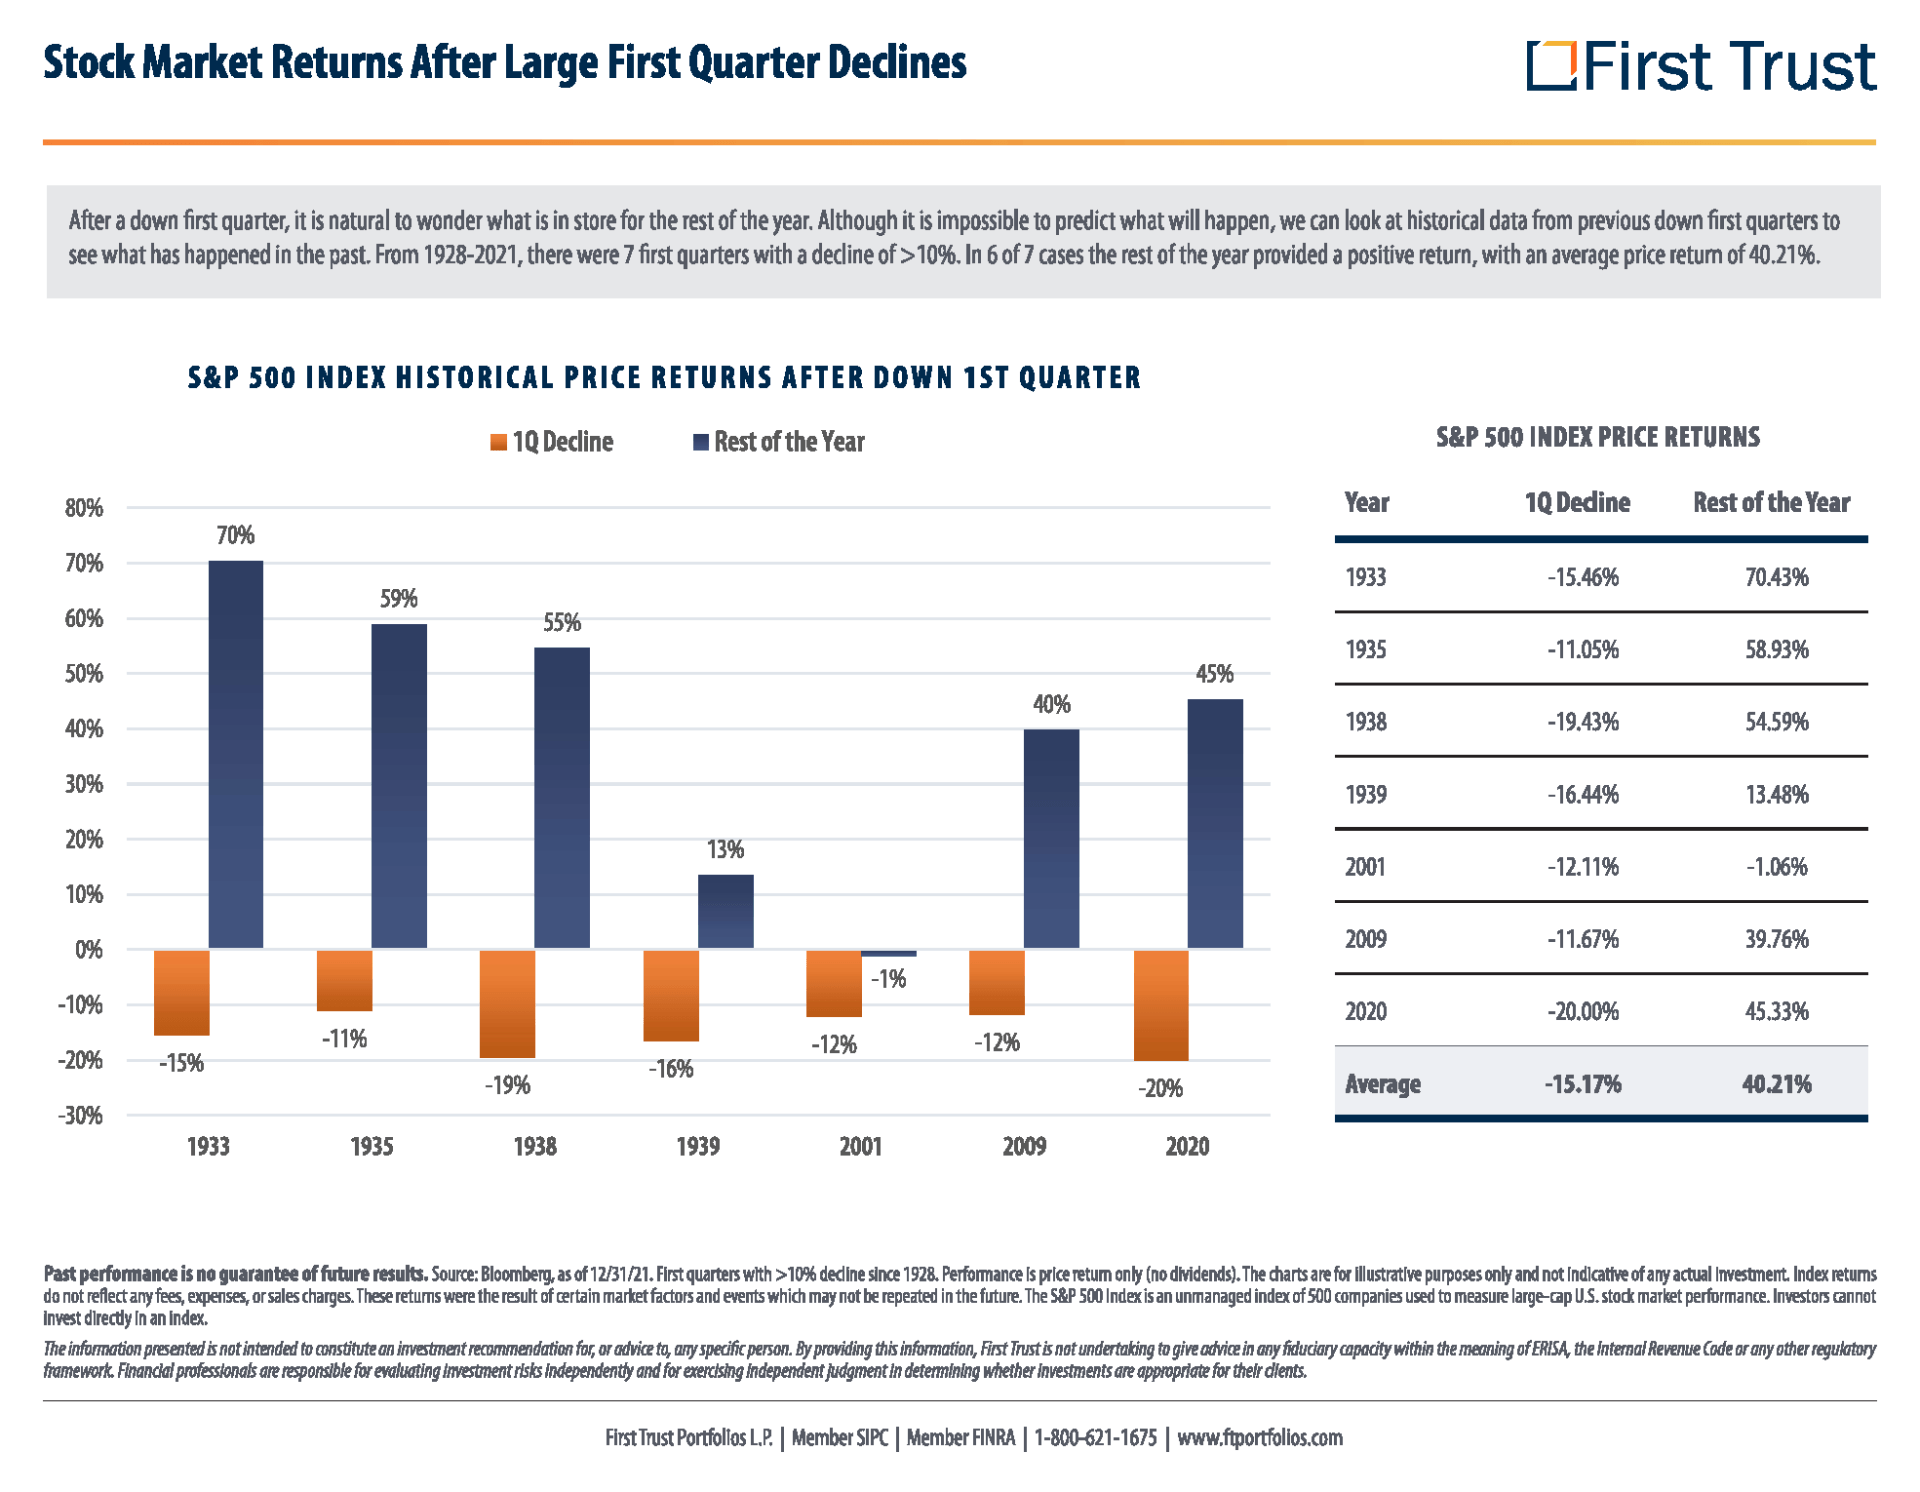
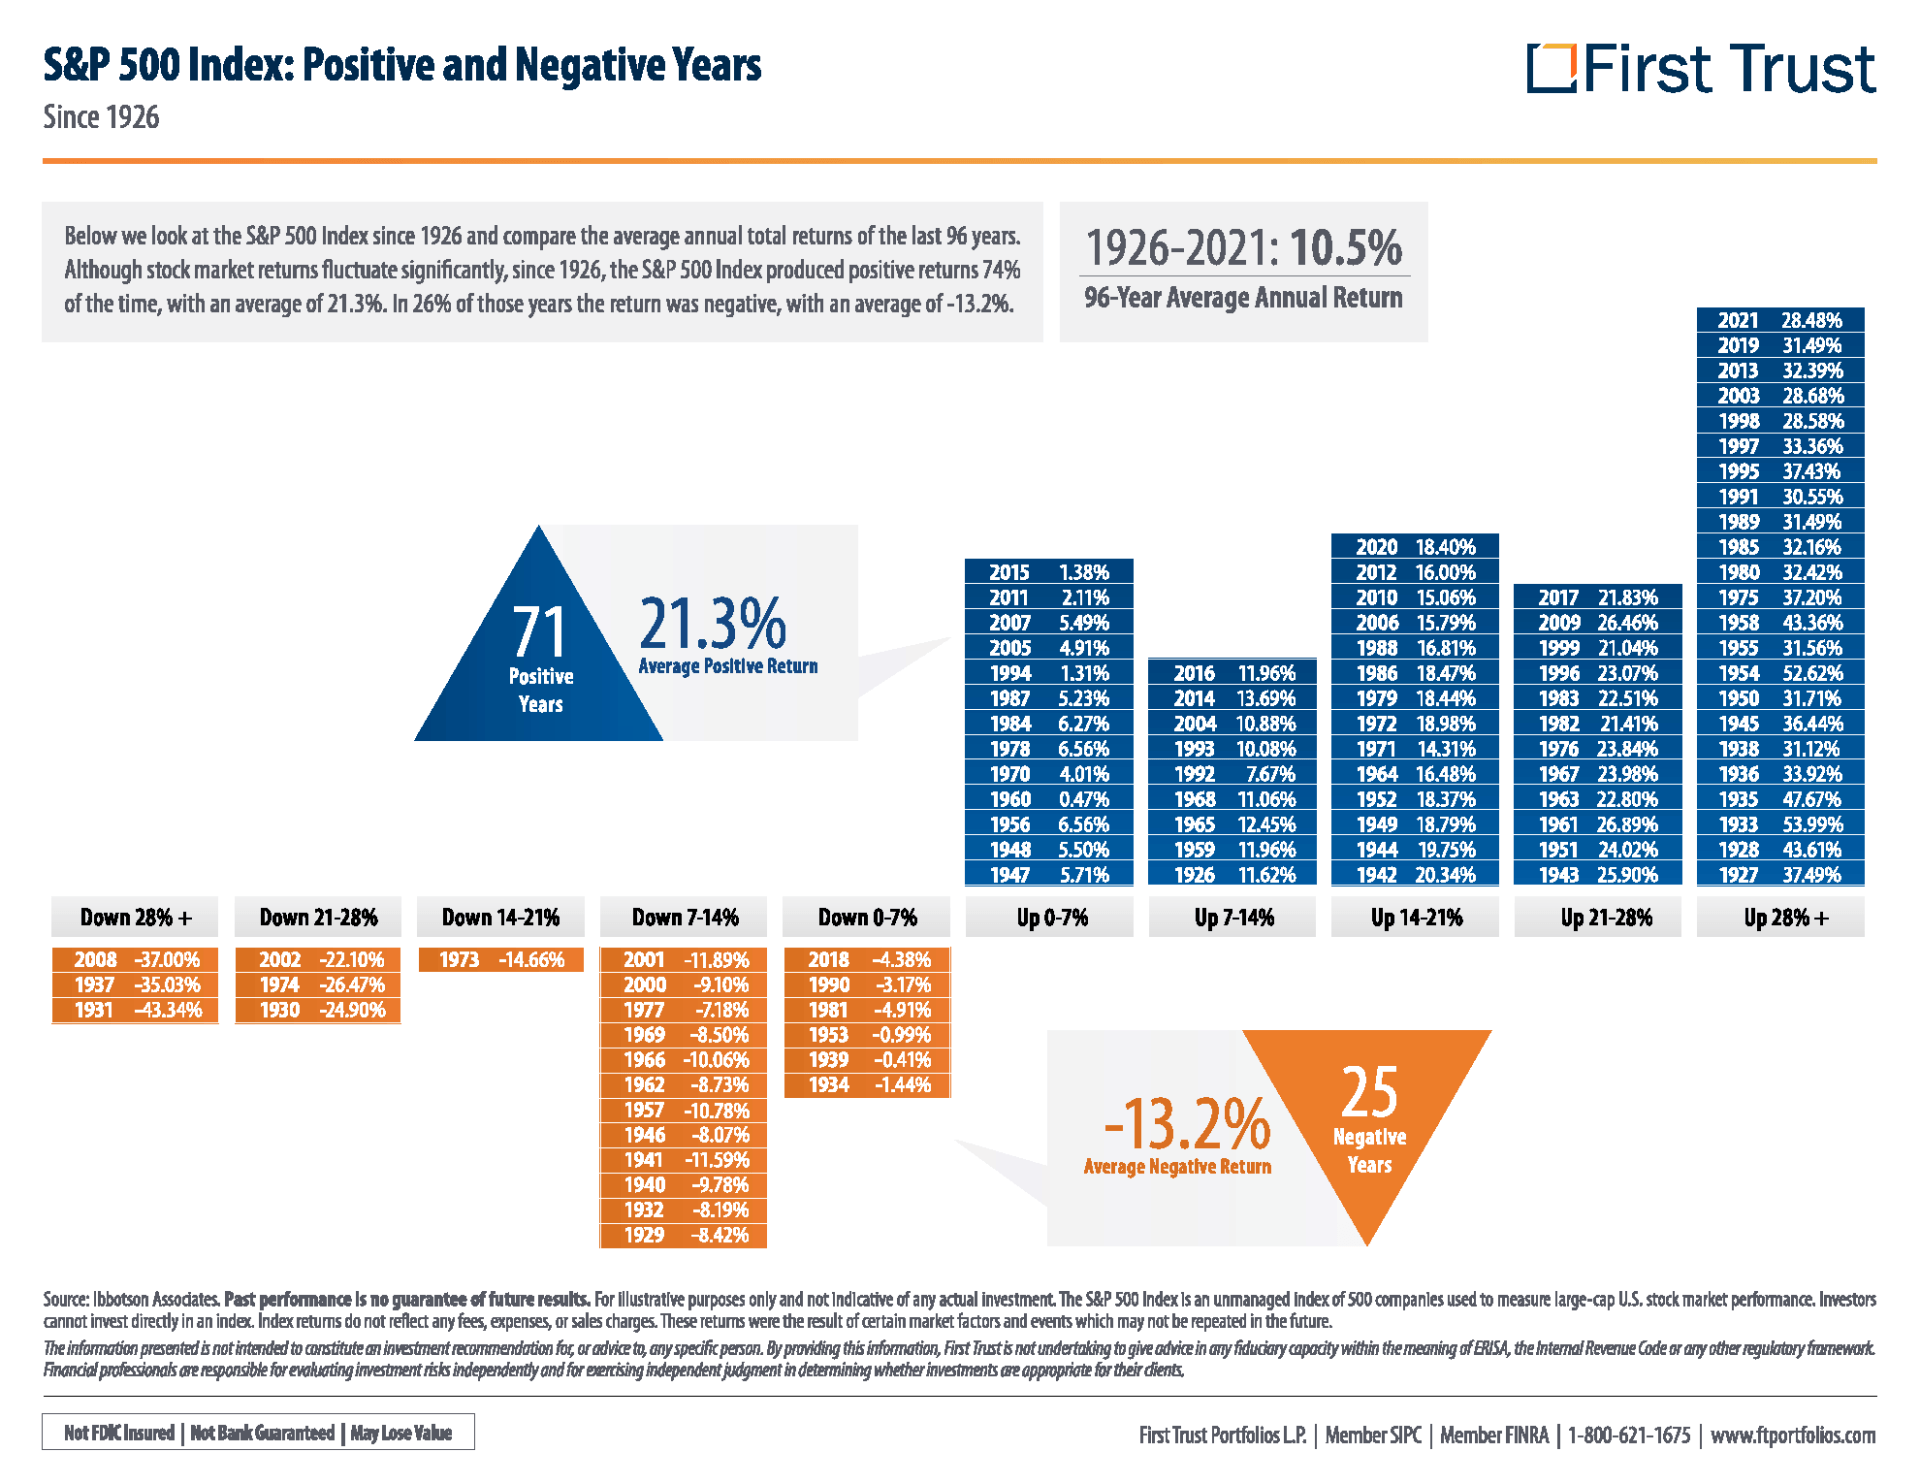
My interest in the “Correction” term is that it often means negative sentiment and selling are much closer to reaching levels that are often followed by positive returns. Included are a few graphs showing how markets have performed historically during other volatile and negative environments. (Select these links - PDF1 or PDF2 - or view the graphs below). Past performance is of course not a guarantee of future returns, but I hope you find the statistics encouraging. The first chart shows average returns following poor performance in 1st quarters of years. Then second is an annualized view that serves as a reminder to stay invested even when longer, negative return environments inevitably occur . . . yet not nearly as often as the positive ones!
Hope this helps!
Jack
Jack Schniepp is a CERTIFIED FINANCIAL PLANNER™ (CFP®, ChFC®) and the owner of Cascade Financial Strategies. CFS is a registered investment advisor located in Bend, Oregon and licensed in Oregon, California, Washington, Arizona and Idaho. They specialize in socially responsible investing which integrates environmental, social, and corporate governance (ESG) criteria into portfolio construction.